MeteoInfo 3.4 was released (2022-8-12)
Add unsigned short and int arithmetic functions in ArrayMath class
Support drawing extra z axis in 3D axes
Add axes_zoom argument in axes3d function
Add status toolbar with run and memory progress bars in MeteoInfoLab GUI
Add popup menu to file dockable
Add labelshift argument in colorbar function
Add skew and kurtosis functions in stats module
Add fimplicit3 plot function
Add __and__, __or__, __xor__ operations in Series class
Add replace function in DataFrame and Series classes
Improve drop function in DataFrame to support rows drop
Add fill plot function
Add multivariate_normal function
Add ColorTransferFunction class
Support vertical boxplot
Support MICAPS MDFS type 12 data file
Add MeshRender and SurfaceRender classes for vbo rendering
Update netcdf-java to version 5.5.3
Update FlatLaf to version 2.4
Update joml to version 1.10.4
Update rsyntaxtextarea to version 3.2.0
Update ojAlgo to version 51.3.0
Update l2fprod to version 6.9.1
Update jts to version 1.19.0
Update jython to version 2.7.3b1
Update Apache commons math to version 4.0-SNAPSHOT from 3.6.1
Some bug fixed
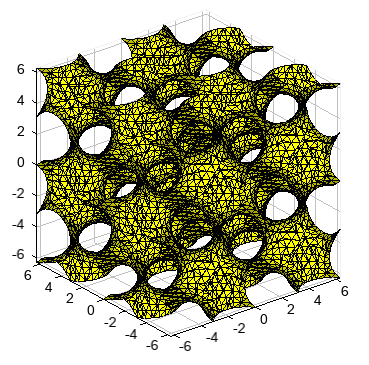
Plot 3-D implicit function:
def f(x, y, z):
    return sin(x) * cos(y) + sin(y) * cos(z) + sin(z) * cos(x)

axes3d(aspect='equal', axes_zoom=True)
lighting()
fimplicit3(f, [-2*pi,2*pi], facecolor='y', edgecolor='k')
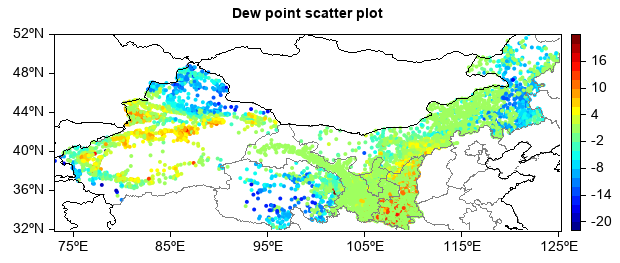
Read and plot MICAPS MDFS type 12 data file:
fn = 'D:/Temp/micaps/mdfs/20220509153000.000'
f = addfile_micaps(fn)
df = f.read_dataframe()
lon = df['Longitude'].values
lat = df['Latitude'].values
t = df['DewPoint'].values

geoshow('cn_province', edgecolor='gray')
geoshow('country')
levs = arange(-20, 21, 2)
scatter(lon, lat, t, levs, size=4, edgecolor=None, zorder=0)
colorbar()
title('Dew point scatter plot')