maskout
- mipylib.geolib.migeo.maskout(data, mask, x=None, y=None)
Maskout data by polygons - NaN values of elements outside polygons.
- Parameters:
mask – (list) Polygon list as maskout borders.
data – (array_like) Array data for maskout.
x – (array_like) X coordinate array.
y – (array_like) Y coordinate array.
- Returns:
(array_like) Maskouted data array.
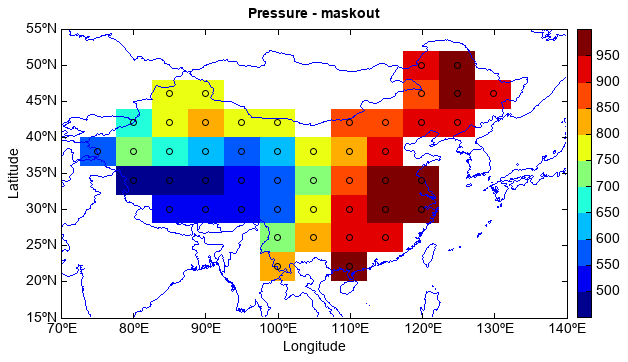
Maskout with polygon shapes
fn = os.path.join(migl.get_sample_folder(), 'GrADS', 'model.ctl')
f = addfile(fn)
ps = f['PS'][0,'10:60','60:140']
lat = ps.dimvalue(0)
lon = ps.dimvalue(1)

#maskout
m_china = shaperead('china')
ps = geolib.maskout(ps, m_china.shapes, lon, lat)

#plot test
axesm()
geoshow('country', edgecolor=(0,0,255))
layer = imshow(ps, 10)
scatter(ps, facecolor=None)
title('Pressure - maskout')
ylabel('Latitude')
xlabel('Longitude')
colorbar(layer)
xlim(70, 140)
ylim(15, 55)
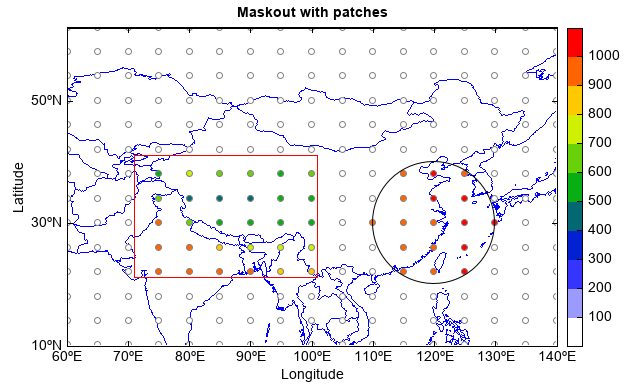
Maskout with patches
fn = os.path.join(migl.get_sample_folder(), 'GrADS', 'model.ctl')
f = addfile(fn)
ps = f['PS'][0,'10:60','60:140']
lat = ps.dimvalue(0)
lon = ps.dimvalue(1)

#maskout
rect = Rectangle([71,21], 30, 20, facecolor=None, edgecolor='r')
circle = Circle([120,30], 10, facecolor=None)
ps = geolib.maskout(ps, [circle, rect], lon, lat)
ps[ps==nan] = 0

#plot test
ax = axesm()
geoshow('country', edgecolor=(0,0,255))
layer = scatter(ps, cmap='WhBlGrYeRe', edgecolor='gray')
ax.add_patch(circle)
ax.add_patch(rect)
title('Pressure')
ylabel('Latitude')
xlabel('Longitude')
yticks([10,30,50])
colorbar(layer)