bar3
- Axes3DGL.bar(x, y, z, width=0.8, bottom=None, cylinder=False, **kwargs):
Make a 3D bar plot of x, y and z, where x, y and z are sequence like objects of the same lengths.
- Parameters:
x – (array_like) Input x data.
y – (array_like) Input y data.
z – (array_like) Input z data.
width – (float) Bar width.
cylinder – (bool) Is cylinder bar or rectangle bar.
bottom – (bool) Color of the points. Or z values.
color – (Color) Optional, the color of the bar faces.
edgecolor – (Color) Optional, the color of the bar edge. Default is black color. Edge line will not be plotted if
edgecolorisNone.linewidth – (int) Optional, width of bar edge.
label – (string) Label of the bar series.
hatch – (string) Hatch string.
hatchsize – (int) Hatch size. Default is None (8).
bgcolor – (Color) Background color, only valid with hatch.
barswidth – (float) Bars width (0 - 1), only used for automatic bar with plot (only one argument without
widthargument). Default is 0.8.
- Returns:
Bar 3D graphics.
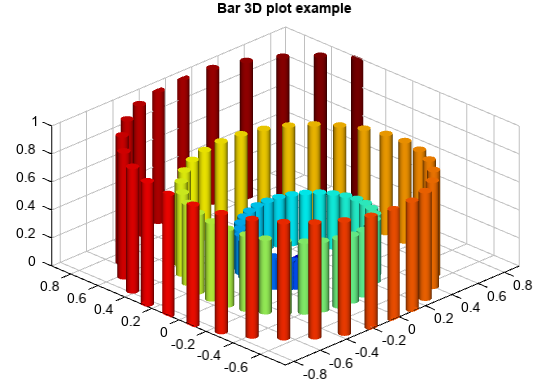
Example of 3D bar plot
z = linspace(0, 1, 100)
x = z * np.sin(20 * z)
y = z * np.cos(20 * z)
c = x + y

lighting(True)
cols = makecolors(len(x))
bar3(x, y, z, width=0.05, color=cols, edgecolor=None, linewidth=1)
title('Bar 3D plot example')
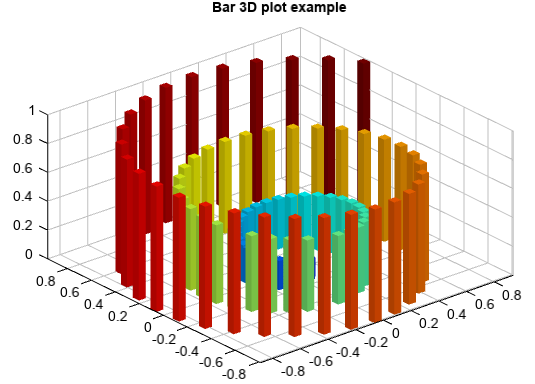
Example of 3D cylinder bar plot
z = linspace(0, 1, 100)
x = z * np.sin(20 * z)
y = z * np.cos(20 * z)
c = x + y

#Plot
lighting(True)
cols = makecolors(len(x))
bar3(x, y, z, width=0.08, color=cols, linewidth=1.5, cylinder=True)
title('Bar 3D plot example')