scatter3
- Axes3DGL.scatter(x, y, z, s=8, c='b', marker='o', **kwargs):
Make a 3D scatter plot of x, y and z, where x, y and z are sequence like objects of the same lengths.
- Parameters:
x – (array_like) Input x data.
y – (array_like) Input y data.
z – (array_like) Input z data.
s – (int) Size of points.
c – (color or array) Color of the points. Or data values for colors.
alpha – (int) The alpha blending value, between 0 (transparent) and 1 (opaque).
marker – (string) Marker of the points.
label – (string) Label of the points series.
levels – (array_like) Optional. A list of floating point numbers indicating the level points to draw, in increasing order.
sphere – (bool) Draw point as sphere or not. Default is None that means False.
- Returns:
Point 3D graphics.
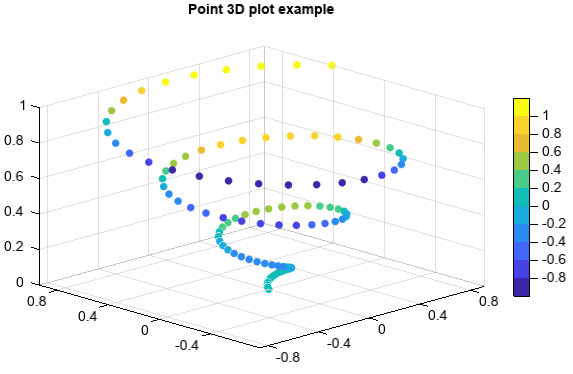
Example of 3D point plot
z = linspace(0, 1, 100)
x = z * np.sin(20 * z)
y = z * np.cos(20 * z)
c = x + y

#Plot
scatter3(x, y, z, c=c)
colorbar(shrink=0.8)
title('Point 3D plot example')
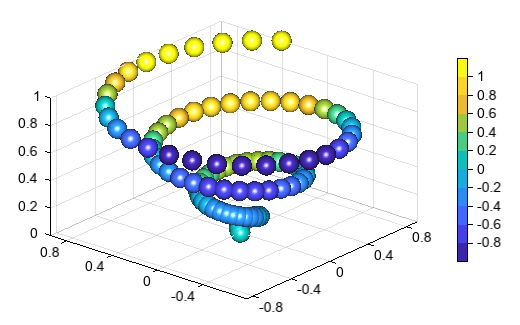
Plot points as sphere
z = linspace(0, 1, 100)
x = z * np.sin(20 * z)
y = z * np.cos(20 * z)
c = x + y

#Plot
axes3d(aspect='equal', axes_zoom=True)
lighting(mat_specular=1)
scatter3(x, y, z, c=c, s=20, sphere=True)
colorbar(shrink=0.8, xshift=60)