plot3
- Axes3DGL.plot(x, y, z, *args, **kwargs):
Plot 3D lines and/or markers to the axes. args is a variable length argument, allowing for multiple x, y pairs with an optional format string.
- Parameters:
x – (array_like) Input x data.
y – (array_like) Input y data.
z – (array_like) Input z data.
cdata – (array_like) Optional, data for colors.
style – (string) Line style for plot.
- Returns:
Legend breaks of the lines.
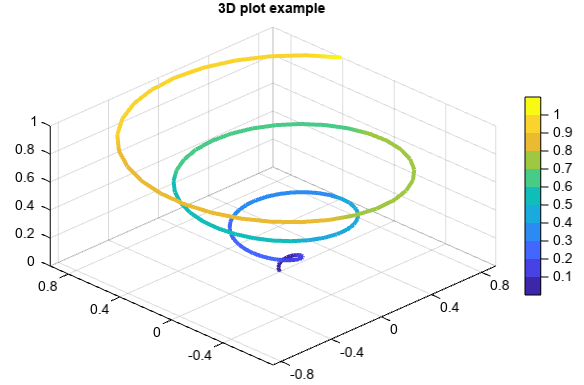
Example of
plot3functionz = linspace(0, 1, 100) x = z * np.sin(20 * z) y = z * np.cos(20 * z) plot3(x, y, z, cdata=z, linewidth=4) colorbar() title('3D plot example')
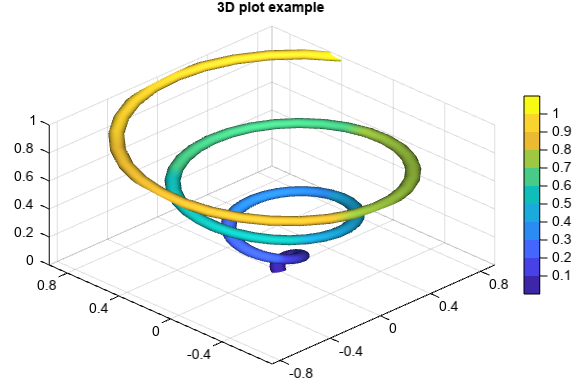
3D plot pipe line
z = linspace(0, 1, 100)
x = z * np.sin(20 * z)
y = z * np.cos(20 * z)

lighting()
plot3(x, y, z, cdata=z, pipe=True, radius=0.05)
colorbar()
title('3D plot example')
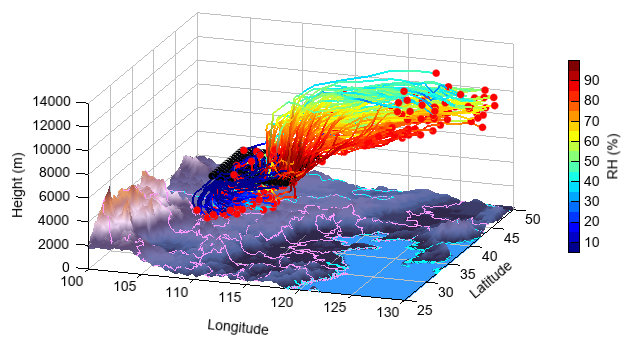
3D map lines and trajectories plot
fn = 'D:/Temp/HYSPLIT/500_previous'

f = addfile_hytraj(fn)
lon = f['lon'][:,:]
lat = f['lat'][:,:]
alt = f['height'][:,:]
rh = f['RELHUMID'][:,:]

#Relief data
rfn = 'D:/Temp/nc/elev.0.25-deg.nc'
rf = addfile(rfn)
elev = rf['data'][0,'15:65','65:155']
elev[elev<0] = -1
lon1 = elev.dimvalue(1)
lat1 = elev.dimvalue(0)
lon1, lat1 = meshgrid(lon1, lat1)

#Map
lchina = shaperead('cn_province')
clon = lchina.x_coord
clat = lchina.y_coord
calt = zeros(len(clon))
h = interp2d(elev, clon, clat)
calt = calt + h
lworld = shaperead('country')
wlon = lworld.x_coord
wlat = lworld.y_coord
walt = zeros(len(wlon))
h = interp2d(elev, wlon, wlat)
walt = walt + h

#Plot
ax = axes3d()
ax.set_elevation(-60)
ax.set_rotation(341)
levs = arange(0, 6000, 200)
cols = makecolors(len(levs) + 1, cmap='SVG_bhw3_22')
cols[0] = [51,153,255]
surf(lon1, lat1, elev, levs, colors=cols,
    facecolor='interp', edgecolor=None, lighting=False)
plot3(clon, clat, calt, color=[255,153,255])
plot3(wlon, wlat, walt, color='c')
levs1 = arange(10, 99, 5)
traj = plot3(lon, lat, alt, mvalues=rh, levels=levs1, linewidth=2)
scatter3(lon[:,0], lat[:,0], alt[:,0], size=6, c='k')
scatter3(lon[:,-1], lat[:,-1], alt[:,-1], size=6, c='r')
colorbar(traj, aspect=30, label='RH (%)')
xlim(100, 130)
xlabel('Longitude')
ylim(25, 50)
ylabel('Latitude')
zlim(0, 14000)
zlabel('Height (m)')