quiver3
- Axes3DGL.quiver(*args, **kwargs):
Plot a 3-D field of arrows.
- Parameters:
x – (array_like) X coordinate array.
y – (array_like) Y coordinate array.
z – (array_like) Z coordinate array.
u – (array_like) U component of the arrow vectors (wind field).
v – (array_like) V component of the arrow vectors (wind field).
w – (array_like) W component of the arrow vectors (wind field).
z – (array_like) Optional, 2-D z value array.
levs – (array_like) Optional. A list of floating point numbers indicating the level vectors to draw, in increasing order.
cmap – (string) Color map string.
fill_value – (float) Fill_value. Default is
-9999.0.scale – (float) The length scale of each quiver, default to 1.0, the unit is the same with the axes.
headwidth – (float) Arrow head width, default is 1.
headlength – (float) Arrow head length, default is 2.5.
- Returns:
(Graphic list) Created quiver graphics.
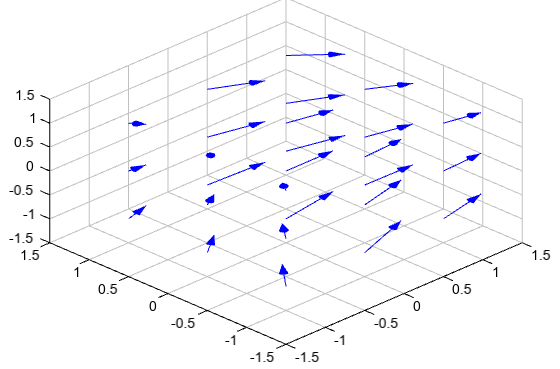
Example of 3D quiver plot
x = y = z = array([-1, 0, 1])
x, y, z = meshgrid(x, y, z)
u = x + cos(4*x) + 3         # x-component of vector field
v = sin(4*x) - sin(2*y)      # y-component of vector field
w = -z                       # z-component of vector field

quiver3(x, y, z, u, v, w, scale=0.15, color='b', headwidth=1.5,
    headlength=5)
xlim(-1.5, 1.5)
ylim(-1.5, 1.5)
zlim(-1.5, 1.5)
antialias()
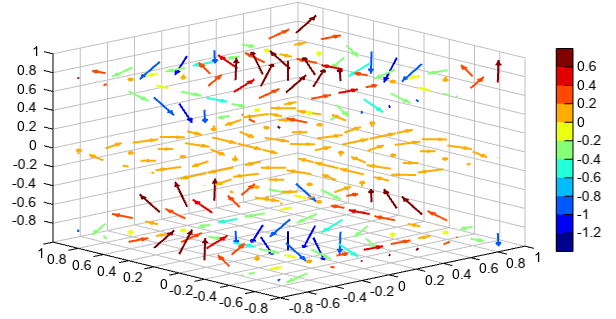
Example of colorful 3D quiver plot
x, y, z = meshgrid(arange(-0.8, 1, 0.2),
           arange(-0.8, 1, 0.2),
           arange(-0.8, 1, 0.8))

u = sin(pi * x) * cos(pi * y) * cos(pi * z)
v = -cos(pi * x) * sin(pi * y) * cos(pi * z)
w = (sqrt(2.0 / 3.0) * cos(pi * x) * cos(pi * y) *
     sin(pi * z))
w = w * 3
speed = sqrt(u*u + v*v + w*w)

quiver3(x, y, z, u, v, w, w, scale=0.2, linewidth=2)
colorbar()
xlim(-0.8, 1)
ylim(-0.8, 1)
zlim(-1, 1)