text3
- Axes3DGL.text(x, y, z, s, zdir=None, **kwargs):
Add text to the plot. kwargs will be passed on to text, except for the zdir keyword, which sets the direction to be used as the z direction.
- Parameters:
x – (float) X coordinate.
y – (float) Y coordinate.
z – (float) Z coordinate.
s – (string) Text string.
zdir – Z direction.
- Returns:
3D text graphics
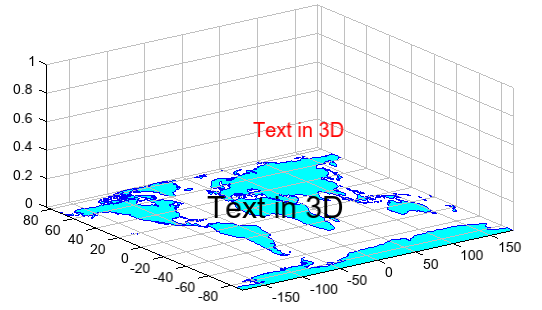
Example of
text3functionax = axes3d() geoshow('continent', color='c', edgecolor='b') text3(0, 0, 0, 'Text in 3D', fontsize=30, zdir='x', ha='center') text3(0, 20, 0.5, 'Text in 3D', color='r', fontsize=20) zlim(0, 1)