streamplot3
- Axes3DGL.streamplot(*args, **kwargs):
Plot stream lines in 3D axes.
- Parameters:
x – (array_like) X coordinate array.
y – (array_like) Y coordinate array.
z – (array_like) Z coordinate array.
u – (array_like) U component of the arrow vectors (wind field).
v – (array_like) V component of the arrow vectors (wind field).
w – (array_like) W component of the arrow vectors (wind field).
density – (int) Streamline density. Default is 4.
- Returns:
Streamlines
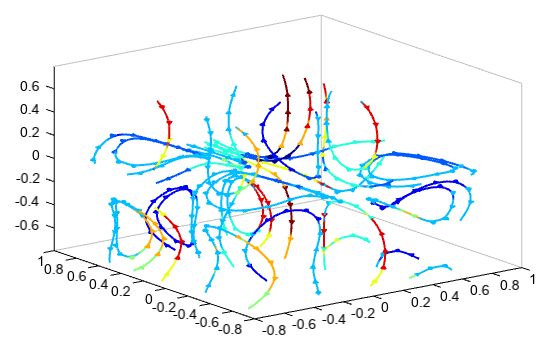
Example of 3D streamline plot
# Make the grid
x, y, z = meshgrid(arange(-0.8, 1, 0.2),
                   arange(-0.8, 1, 0.2),
                   arange(-0.8, 1, 0.2))

# Make the direction data for the arrows
u = sin(pi * x) * cos(pi * y) * cos(pi * z)
v = -cos(pi * x) * sin(pi * y) * cos(pi * z)
w = (sqrt(2.0 / 3.0) * cos(pi * x) * cos(pi * y) *
     sin(pi * z))
w = w * 3
speed = sqrt(u*u + v*v + w*w)

axes3d()
grid(False)
streamplot3(x[0,0,:], y[0,:,0], z[:,0,0], u, v, w, speed,
    linewidth=2, density=4)
xlim(-0.8, 1)
ylim(-0.8, 1)
antialias()
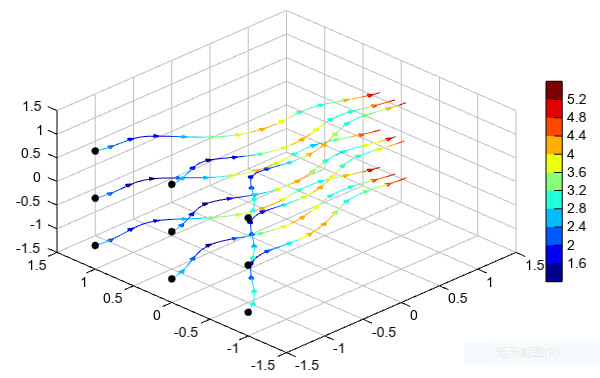
3D streamline plot with start positions
# Make the grid
x, y, z = meshgrid(arange(-1.5, 1.5, 0.1),
                   arange(-1.5, 1.5, 0.1),
                   arange(-1.5, 1.5, 0.1))

# Make the direction data for the arrows
u = x + cos(4*x) + 3         # x-component of vector field
v = sin(4*x) - sin(2*y)      # y-component of vector field
w = -z                       # z-component of vector field
speed = sqrt(u*u + v*v + w*w)

sx, sy, sz = meshgrid([-1.5], [-1,0,1], [-1,0,1])

qq = streamplot3(x, y, z, u, v, w, speed, linewidth=2,
    density=4, interval=10, start_x=sx, start_y=sy, start_z=sz)
scatter3(sx, sy, sz, c='k')
colorbar(qq)
xlim(-1.5, 1.5)
ylim(-1.5, 1.5)
zlim(-1.5, 1.5)
antialias(True)
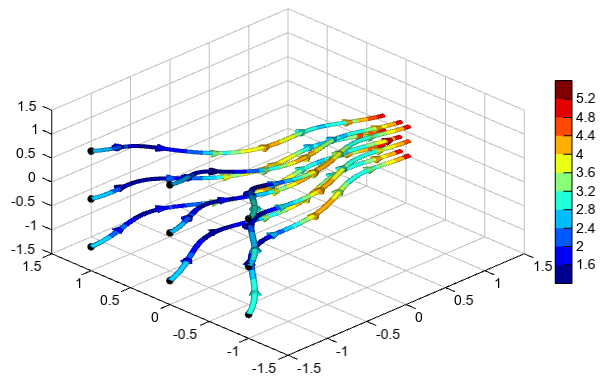
3D streamline plot with pipe line
# Make the grid
x, y, z = meshgrid(arange(-1.5, 1.5, 0.1),
                   arange(-1.5, 1.5, 0.1),
                   arange(-1.5, 1.5, 0.1))

# Make the direction data for the arrows
u = x + cos(4*x) + 3         # x-component of vector field
v = sin(4*x) - sin(2*y)      # y-component of vector field
w = -z                       # z-component of vector field
speed = sqrt(u*u + v*v + w*w)

sx, sy, sz = meshgrid([-1.5], [-1,0,1], [-1,0,1])

lighting()
qq = streamplot3(x, y, z, u, v, w, speed, linewidth=2, headwidth=2,
    density=4, interval=20, start_x=sx, start_y=sy, start_z=sz,
    pipe=True, radius=0.02)
scatter3(sx, sy, sz, c='k')
colorbar(qq)
xlim(-1.5, 1.5)
ylim(-1.5, 1.5)
zlim(-1.5, 1.5)
antialias(True)