surf
- Axes3DGL.surf(*args, **kwargs):
creates a three-dimensional surface plot
- Parameters:
x – (array_like) Optional. X coordinate array.
y – (array_like) Optional. Y coordinate array.
z – (array_like) 2-D z value array.
cmap – (string) Color map string.
lighting – (bool) Using light or not.
- Returns:
3D surface graphic
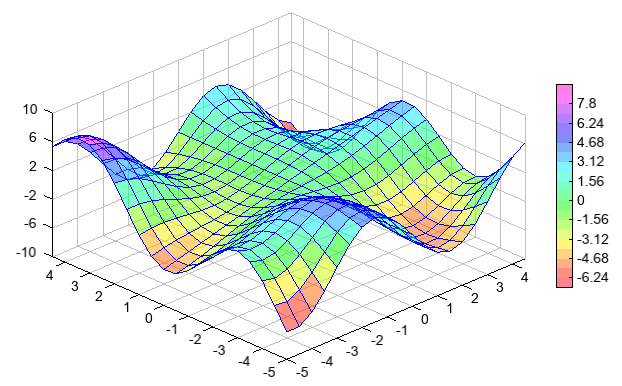
Example of 3D surface plot
x = y = arange(-5, 5, 0.5)
x, y = meshgrid(x, y)
z = y * sin(x) + x * cos(y)

surf(x, y, z, 20, edgecolor='b', cmap='MPL_gist_rainbow',
    facecolor='flat', alpha=0.5)
colorbar(shrink=0.8, ticklen=2)
zlim(-10, 10)
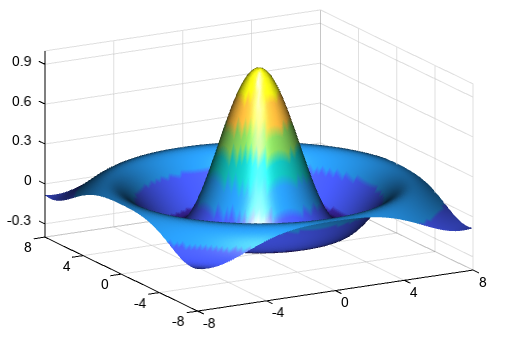
3D surface plot with lighting
tx = ty = linspace(-8, 8, 81)
xx, yy = meshgrid(tx, ty)
r = sqrt(xx ** 2 + yy ** 2) + 2.2204e-16
tz = sin(r) / r

#Plot
lighting(mat_specular=1)
surf(xx, yy, tz, facecolor='interp', edgecolor=None)
zlim(-0.4, 1)
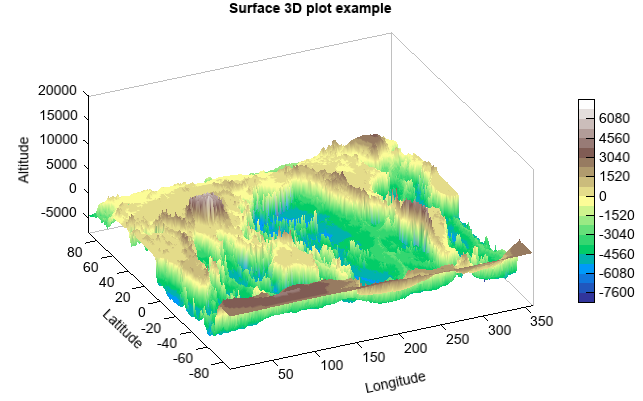
3D surface relief plot
#Relief data
fn = 'D:/Temp/nc/elev.0.25-deg.nc'
f = addfile(fn)
elev = f['data'][0,::4,::4]
lon = elev.dimvalue(1)
lat = elev.dimvalue(0)
lon, lat = meshgrid(lon, lat)

#Plot
axes3d()
grid(False)
surf(lon, lat, elev, 20, cmap='MPL_terrain', facecolor='interp', edgecolor=None)
zlim(-8000, 20000)
xlabel('Longitude')
ylabel('Latitude')
zlabel('Altitude')
colorbar(shrink=0.8)
title('Surface 3D plot example')
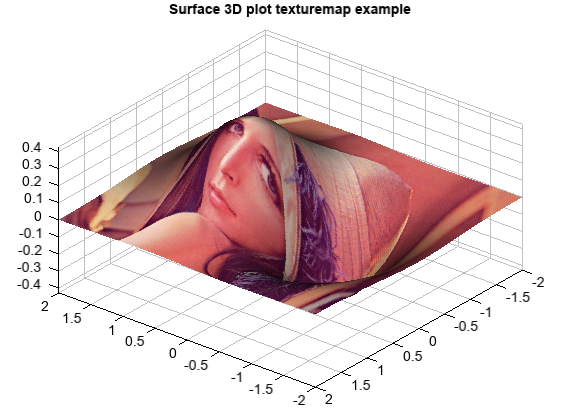
Surface plot with texture map
x = linspace(-2, 2, 25)
y = linspace(-2, 2, 25)
x, y = meshgrid(x, y)
z = x * exp(-x ** 2 - y ** 2)

fn = os.path.join(migl.get_sample_folder(), 'image', 'Lenna.png')
lena = imagelib.imread(fn)

#Plot
lighting(True)
surf(x, y, z, facecolor='texturemap', cdata=lena, edgecolor=None)
title('Surface 3D plot texturemap example')