mesh
- Axes3DGL.mesh(*args, **kwargs):
creates a three-dimensional wireframe plot
- Parameters:
x – (array_like) Optional. X coordinate array.
y – (array_like) Optional. Y coordinate array.
z – (array_like) 2-D z value array.
cmap – (string) Color map string.
xyaxis – (boolean) Draw x and y axis or not.
zaxis – (boolean) Draw z axis or not.
grid – (boolean) Draw grid or not.
boxed – (boolean) Draw boxed or not.
mesh – (boolean) Draw mesh line or not.
- Returns:
Mesh graphics
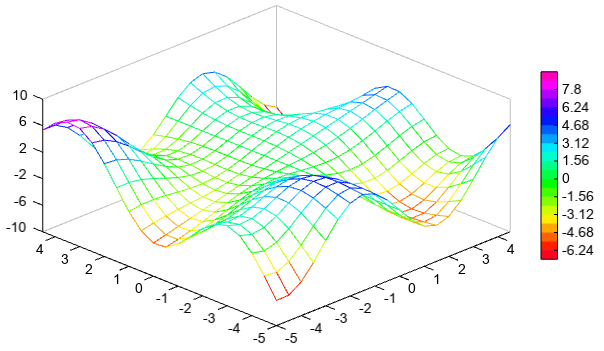
Example of 3D
meshfunctionx = y = arange(-5, 5, 0.5) x, y = meshgrid(x, y) z = y * sin(x) + x * cos(y) # Plot axes3d() grid(False) mesh(x, y, z, 20, cmap='MPL_gist_rainbow') colorbar(shrink=0.8, ticklen=2) zlim(-10, 10)