gridshow
- mipylib.plotlib.miplot.gridshow(*args, **kwargs)
Display an grid plot.
- Parameters:
x – (array_like) Optional. X coordinate array.
y – (array_like) Optional. Y coordinate array.
z – (array_like) 2-D z value array.
levs – (array_like) Optional. A list of floating point numbers indicating the level curves to draw, in increasing order.
cmap – (string) Color map string.
colors – (list) If None (default), the colormap specified by cmap will be used. If a string, like ‘r’ or ‘red’, all levels will be plotted in this color. If a tuple of matplotlib color args (string, float, rgb, etc), different levels will be plotted in different colors in the order specified.
fill_value – (float) Fill_value. Default is
-9999.0.
- Returns:
(GraphicCollection) Polygon graphic collection.
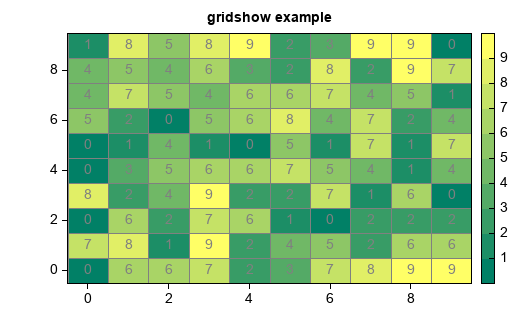
Example:
x = arange(10)
y = arange(10)
z = random.randint(0, 10, (10,10))
gg = gridshow(x, y, z, edgecolor='gray', cmap='MPL_summer')
colorbar(gg)
xaxis(tickin=False)
xaxis(tickline=False, location='top')
yaxis(tickin=False)
yaxis(tickline=False, location='right')
for i in range(len(x)):
    for j in range(len(y)):
        text(x[i], y[j], str(z[j,i]), color='gray', xalign='center', yalign='center')
title('gridshow example')