legend
- mipylib.plotlib.miplot.legend(*args, **kwargs)
Places a legend on the axes.
- Parameters:
breaks – (ColorBreak) Legend breaks (optional).
labels – (list of string) Legend labels (optional).
loc – (string) The location of the legend, including: ‘upper right’, upper left’, ‘lower left’, ‘lower right’, ‘right’, ‘ceter left’, ‘center right’, lower center’, ‘upper center’, ‘center’ and ‘custom’. Default is ‘upper right’.
x – (float) Location x in normalized (0, 1) units when
loc='custom'.y – (float) Location y in normalized (0, 1) units when
loc='custom'.frameon – (boolean) Control whether a frame should be drawn around the legend. Default is True.
background – (None or color) Set draw background or not and/or background color. Default is None which set not draw background.
fontname – (string) Font name. Default is
Arial.fontsize – (int) Font size. Default is
14.bold – (boolean) Is bold font or not. Default is
False.labcolor – (color) Tick label string color. Default is
black.
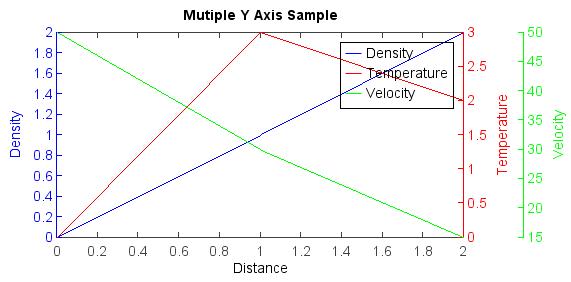
Example:
ax1 = axes(position=[0.113,0.15,0.7,0.8])
yaxis(ax1, color='b')
line1 = plot([0, 1, 2], [0, 1, 2], 'b-', label="Density")
xlabel('Distance')
ylabel('Density', color='b')
title('Mutiple Y Axis Sample')

ax2 = twinx(ax1)
yaxis(ax2, color='r')
line2 = plot([0, 1, 2], [0, 3, 2], 'r-', label="Temperature")
ylabel('Temperature', color='r')

ax3 = twinx(ax1)
yaxis(ax3, shift=60, color='g')
line3 = plot([0, 1, 2], [50, 30, 15], 'g-', label="Velocity")
ylabel('Velocity', color='g')
lines = [line1, line2, line3]
legend(lines)