loglog
- mipylib.plotlib.miplot.loglog(*args, **kwargs)
Make a plot with log scaling on both x and y axis.
- Parameters:
x – (array_like) Input x data.
y – (array_like) Input y data.
style – (string) Line style for plot.
- Returns:
Legend breaks of the lines.
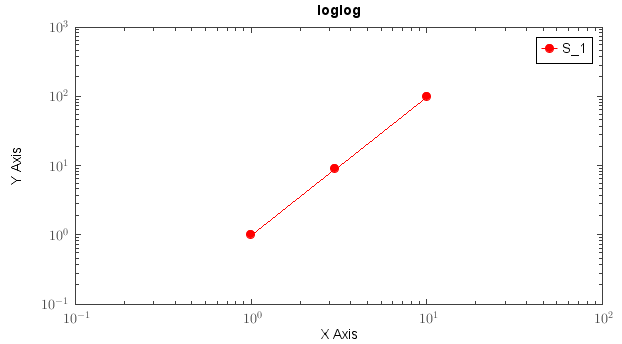
Examples:
x = [1,3,10]
y = [1,9,100]
loglog(x, y, 'r-o')
ylabel('Y Axis')
xlabel('X Axis')
xlim(1e-1, 1e2)
ylim(1e-1, 1e3)
legend()
set(plt.gca, xminortick=True, yminortick=True)
title('loglog')