scatter
- mipylib.plotlib.miplot.scatter(x, y, s=8, c='b', marker='o', label='S_0')
Make a scatter plot of x vs y, where x and y are sequence like objects of the same lengths.
- Parameters:
x – (array_like) Input x data.
y – (array_like) Input y data.
s – (int) Size of points.
c – (Color) Color of the points.
marker – (string) Marker of the points.
label – (string) Label of the points series.
- Returns:
Points legend break.
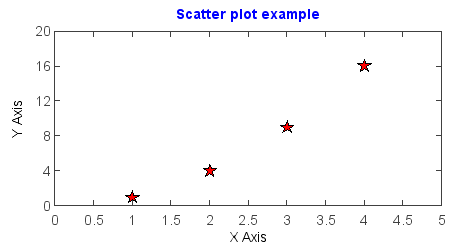
Examples:
x = [1,2,3,4]
y = [1,4,9,16]
scatter(x, y, marker='S', s=14, color='r')
ylabel('Y Axis')
xlabel('X Axis')
axis([0,5,0,20])
title('Scatter plot example', color='b')