Extract temporal data at a special location from grid data
DimArray has interpn function used to extract a data value with special dimension values. The example
below read the array data from a ARL data file and extract temporal data at a special location.
Extract temporal data
#Set station longitude/latitude
lon = 116.4
lat = 40.3

#Add data file
f = addfile('D:/Temp/arl/gdas1.mar15.w5')

#Read data array
pblh = f['PBLH'][:,:,:]
u = f['U10M'][:,:,:]
v = f['V10M'][:,:,:]
ws = sqrt(u * u + v * v)

#Get time dimension number
tn = pblh.dimlen(0)

#Output data file
ofn = 'D:/Temp/arl/st_test.csv'
of = open(ofn, 'w')
of.write('time,pblh,ws\n')

#Loop
for i in range(tn):
    t = f.gettime(i)
    #Interpolate to station
    pblh_st = pblh[i,:,:].interpn([lat, lon])
    ws_st = ws[i,:,:].interpn([lat, lon])
    line = '%s,%.2f,%.2f' % (t.strftime('%Y-%m-%d_%H'), pblh_st, ws_st)
    print line
    of.write(line + '\n')
of.close()
Read extracted data and plot
fn = 'D:/Temp/arl/st_test.csv'
table = readtable(fn, delimiter=',', format='%{yyyy-MM-dd_HH}D%2f')
t = table['time']
pblh = table['pblh']
ws = table['ws']
#Plot
ax1 = axes()
yaxis(ax1, color='r')
plot(t, pblh, 'r-o')
xaxis(axistype='time')
ylabel('Height (m)')
xlim(t[0], t[-1])
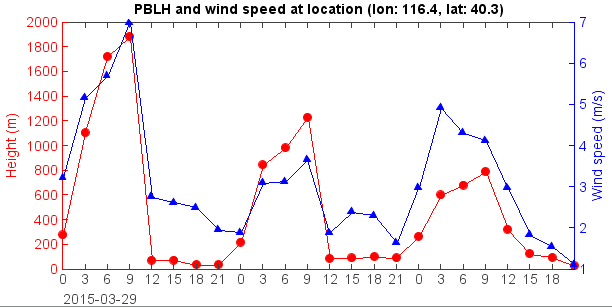
title('PBLH and wind speed at location (lon: 116.4, lat: 40.3)')
ax2 = twinx(ax1)
yaxis(ax2, color='b')
plot(t, ws, 'b-^')
ylabel('Wind speed (m/s)')
xlim(t[0], t[-1])