Write shape file
The created vector layer by contourm() or contourfm() functions can be save as a shape file, which
can be used in MeteoInfo desktop or other GIS softwares such as ArcGIS.
#Add file
f = addfile('D:/Temp/grib/fnl_20110416_00_00')
#Get levels value (high to low order in dataset)
levs = f['isobaric3'][:]
nlev = len(levs)
tidx = 0
lidx = nlev - 1    #First level from ground
#Get 2-D temperature data at specific time and level
data = f['Temperature_isobaric'][tidx,lidx,:,:]
#Plot
axesm()
#Specific legend setting
vlevs = [240,245,250,255,265,270,275,280,285,290,295,300]
layer = contourf(data, vlevs, isplot=False)
outfn = 'D:/Temp/test/temp_test.shp'
layer.save(outfn)
print 'Finished!'
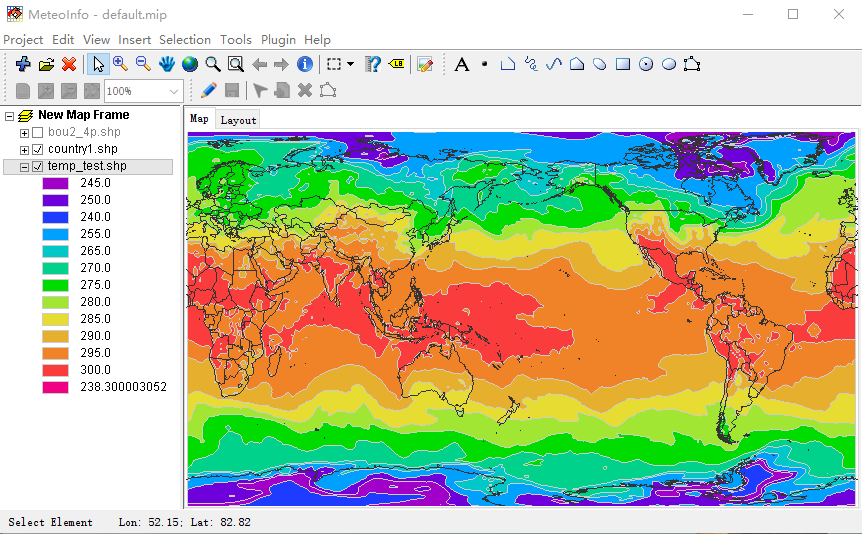
The shape file created from above script was opened in MeteoInfo desktop software.