Fill between chart
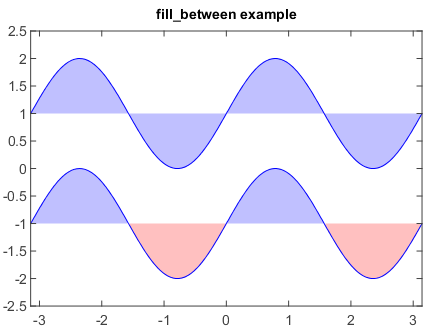
Fill between chart was created by fill_between() function with x, y1 and y2 arrays. Polygon will be
filled between two curves (y1 and y2). Also the fill parts could be controlled by where argument.
n = 256
X = linspace(-pi,pi,n,endpoint=True)
Y = sin(2*X)

fill_between(X, 1, Y+1, color='blue', alpha=.25)
plot(X, Y+1, color='blue')

fill_between(X, -1, Y-1, (Y-1) > -1, color='blue', alpha=.25)
fill_between(X, -1, Y-1, (Y-1) < -1, color='red',  alpha=.25)
plot(X, Y-1, color='blue')
xlim(-pi, pi)
ylim(-2.5, 2.5)
title('fill_between example')