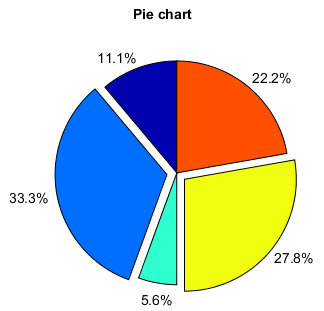
Pie chart
Pie chart was created by pie() function.
x = [1, 3, 0.5, 2.5, 2]
pie(x, explode=[0,1,0,1,0], startangle=90, autopct='%.1f%%')
title('Pie chart')
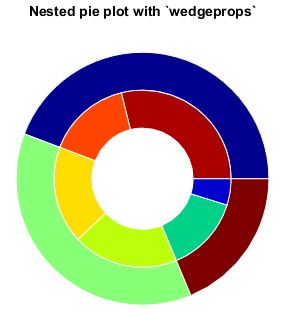
Nested pie.
size = 0.3
vals = array([[60., 32.], [37., 40.], [29., 10.]])

pie(vals.sum(axis=1), radius=1,
       wedgeprops=dict(width=size, edgecolor='w'))
pie(vals.flatten(), radius=1-size, cmap='GMT_seis',
       wedgeprops=dict(width=size, edgecolor='w'))
title('Nested pie plot with `wedgeprops`')