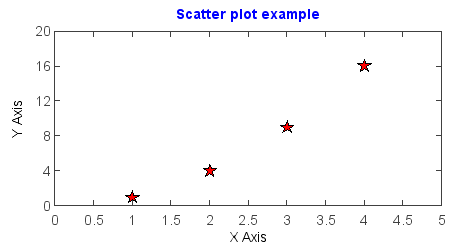
Scatter plot
Scatter plot was created by scatter() function.
x = [1,2,3,4]
y = [1,4,9,16]
scatter(x, y, marker='S', s=14, c='r')
ylabel('Y Axis')
xlabel('X Axis')
axis([0,5,0,20])
title('Scatter plot example', color='b')
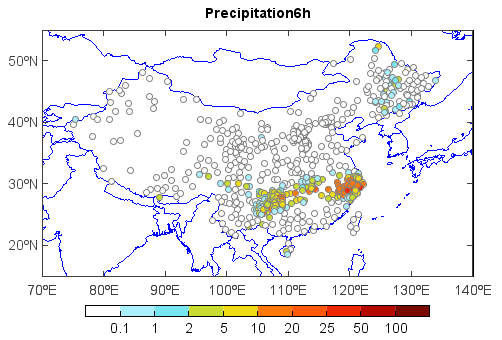
Scatter map plot.
fn = os.path.join(migl.get_sample_folder(), 'MICAPS', '10101414.000')
f = addfile_micaps(fn)
vname = 'Precipitation6h'
pr = f[vname][:]
lon = f['Longitude'][:]
lat = f['Latitude'][:]
layer = shaperead('china')
pr, lon, lat = rmaskout(pr, lon, lat, layer.shapes())
axesm()
geoshow('country', edgecolor=(0,0,255))
levs = [0.1, 1, 2, 5, 10, 20, 25, 50, 100]
cols = [(255,255,255),(170,240,255),(120,230,240),(200,220,50),(240,220,20),(255,120,10),(255,90,10), \
    (240,40,0),(180,10,0),(120,10,0)]
layer = scatter(lon, lat, pr, levs, colors = cols, s=2, edgecolor='gray')
title(vname)
yticks(arange(20, 51, 10))
xlim(70, 140)
ylim(15, 55)
colorbar(layer, orientation='horizontal', shrink=0.8, aspect=30)