Earth global 3-D plots
Create an earth global 3D axes (EarthAxes3D object) using axes3d(projection='earth') function.
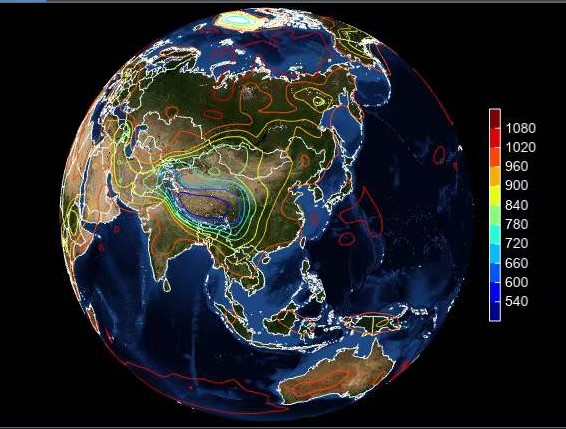
Contour on 3D earth:
fn = os.path.join(migl.get_sample_folder(), 'GrADS', 'model.ctl')
f = addfile(fn)
data = f['PS'][0]
lat = data.dimvalue(0)
lon = data.dimvalue(1)

ax = axes3d(projection='earth')
geoshow('country', edgecolor='gray')
contour(lon, lat, data, 10, offset=0)
colorbar(tickcolor='w', xshift=50)
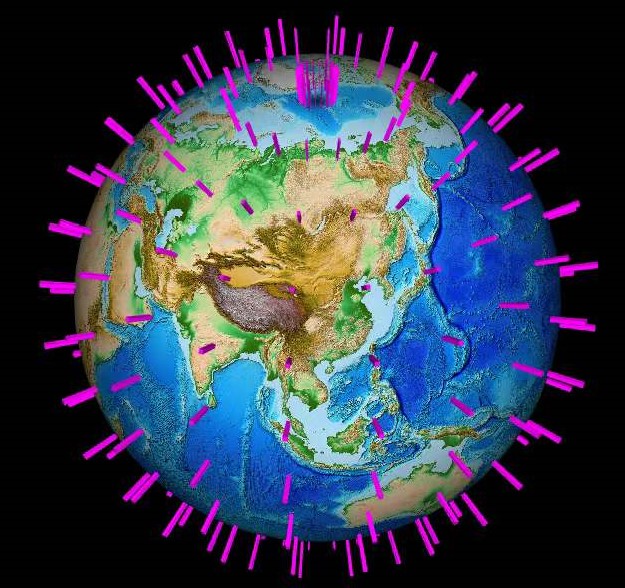
Bars on 3D earth:
fn = os.path.join(migl.get_sample_folder(), 'GrADS', 'model.ctl')
f = addfile(fn)
data = f['PS'][0,::4,::4]
lat = data.dimvalue(0)
lon = data.dimvalue(1)
lon, lat = meshgrid(lon, lat)

ax = axes3d(projection='earth', image='etopo1.jpg')
lighting()
bar3(lon, lat, data, color='m', edgecolor=None, width=1)
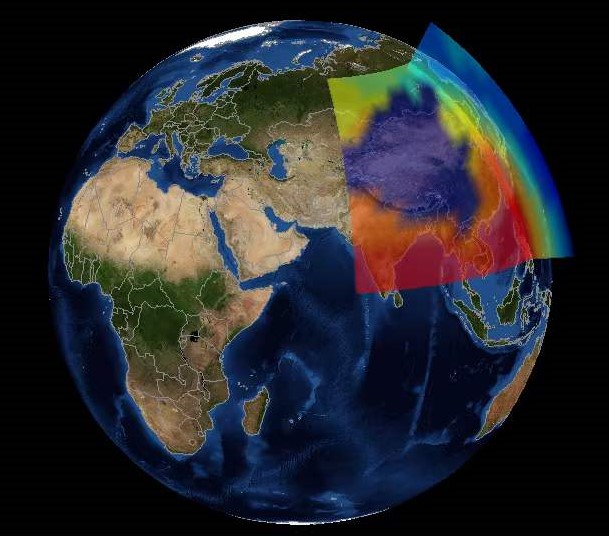
Slices on 3D earth:
fn = os.path.join(migl.get_sample_folder(), 'GrADS', 'model.ctl')
f = addfile(fn)
data = f['T'][0,:,'10:60','70:140']
levels = data.dimvalue(0)
height = meteolib.pressure_to_height_std(levels) / 10
lat = data.dimvalue(1)
lon = data.dimvalue(2)

ax = axes3d(projection='earth')
geoshow('country', edgecolor='gray')
slice3(lon, lat, height, data, 10, xslice=[120], zslice=[300], facecolor='interp',
    edgecolor=None, alpha=0.5)
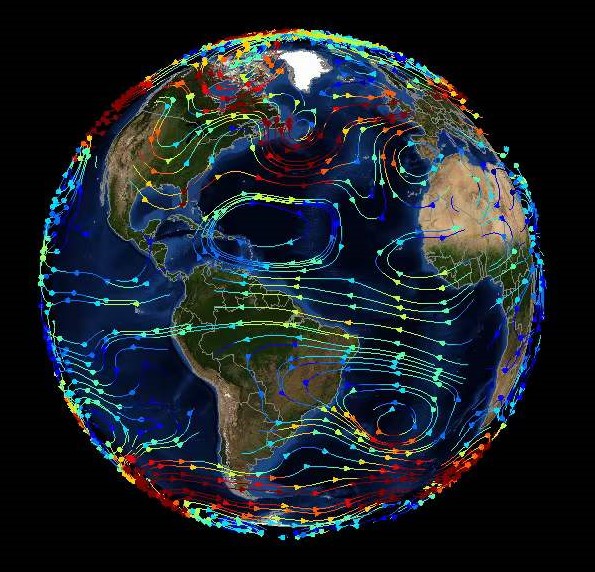
Stream slice on 3D earth:
fn = os.path.join(migl.get_sample_folder(), 'GrADS', 'model.ctl')
f = addfile(fn)
u = f['U'][0]
v = f['V'][0]
levels = u.dimvalue(0)
height = meteolib.pressure_to_height_std(levels) / 10
lat = u.dimvalue(1)
lon = u.dimvalue(2)
w = zeros(u.shape)
speed = sqrt(u*u + v*v)

ax = axes3d(projection='earth')
geoshow('country', edgecolor='gray')
levs = arange(2, 20, 2)
streamslice(lon, lat, height, u, v, w, speed, levs=levs, zslice=[300],
    interval=10)
colorbar(tickcolor='w', xshift=80)