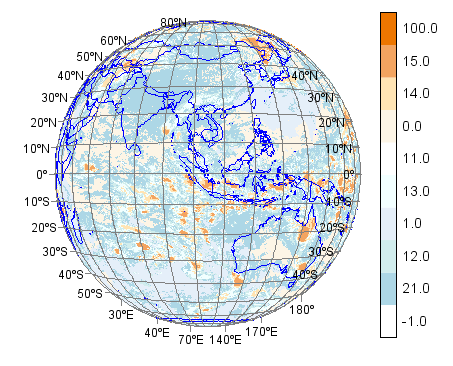
FY-2C cloud data
This example code illustrates how to access and visualize a FY-2C satellite cloud data.
#Add data file
fn = 'D:/Temp/hdf/FY2C_CLC_MLT_NOM_20070730_1800.hdf'
f = addfile(fn)

#Get data variable
v = f['FY2C_Hourly_Cloud_Classification']

#Set x/y
x = linspace(-5750000.0,5750000.0, 2288)
y = linspace(-5750000.0,5750000.0, 2288)

#Get data array
cloud = v[:,:]

#Plot
ax = axesm(proj='geos', lon_0=104.5, h=35785864, gridlabel=True, gridline=True, frameon=False)
geoshow('country', edgecolor=(0,0,255))
cols = makecolors(10, cmap='hotcold_18lev')
cols[0] = 'w'
layer = imshow(x, y, cloud, proj=ax.proj, colors=cols)
colorbar(layer)