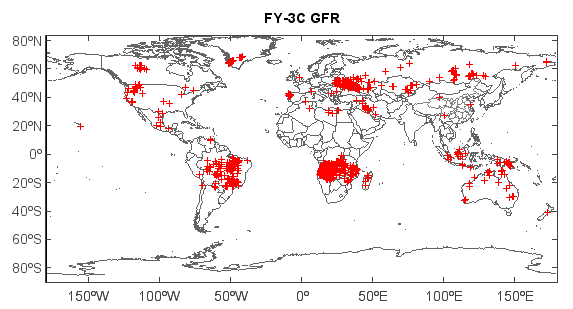
FY-3C global fire data
This example code illustrates how to access and visualize a FY-3C satellite global fire data.
#Add data file
fn = 'D:/Temp/hdf/FY3C_VIRRX_GBAL_L2_GFR_MLT_GLL_20150811_POAD_1000M_MS.HDF'
f = addfile(fn)

#Get data variable
v = f['FIRES']

#Get data array
data = v[:,5]
lat = v[:,3]
lon = v[:,4]

#Plot
axesm()
geoshow('cn_province', edgecolor='gray')
geoshow('country', edgecolor=(100,100,100))
layer = scatter(lon, lat, data, s=3, colors=['r'], edge=False, marker='+')
#colorbar(layer)
title('FY-3C GFR')
axism()