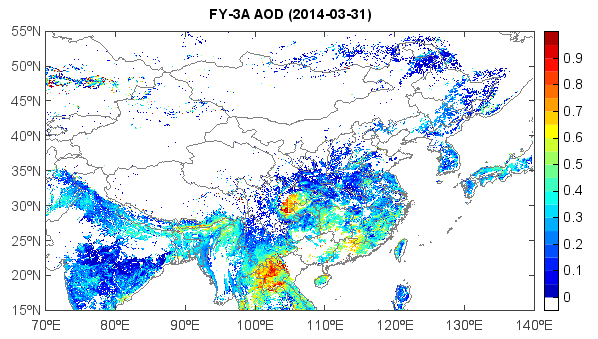
FY-3A AOD data
This example code illustrates how to access and visualize a FY-3A satellite AOD (Aerosol Optical Depth) data. It’s global data with 0.05 degree resolution.
#Add data file
fn = 'D:/Temp/hdf/FY3A_MERSI_GBAL_L3_ASL_MLT_GLL_20140331_AOAM_5000M_MS.HDF'
f = addfile(fn)

#Get data variable
v = f['Aerosol_Optical_Thickness_of_MERSI_550nm']

#Set x/y
x = arange1(-30.0,7200, 0.05)
y = arange1(-90.0,3600, 0.05)

#Set x/y dimensions
v.setdim('Y', y, 0)
v.setdim('X', x, 1)

#Get data array
aod = v[:,:]
#aod = v['15:55','70:140']
aod = aod[::-1,:] / 10000.
aod = aod['15:55','70:140']

#Plot
axesm()
geoshow('cn_province', edgecolor='gray')
geoshow('country')
levs = arange1(0, 20, 0.05)
cols = makecolors(len(levs)+1, cmap='matlab_jet')
cols[0] = 'w'
layer = imshow(aod, levs, colors=cols)
colorbar(layer)
title('FY-3A AOD (2014-03-31)')