NSIDC brightness temperatures
This example code illustrates how to access and visualize NSIDC brightness temperatures data.
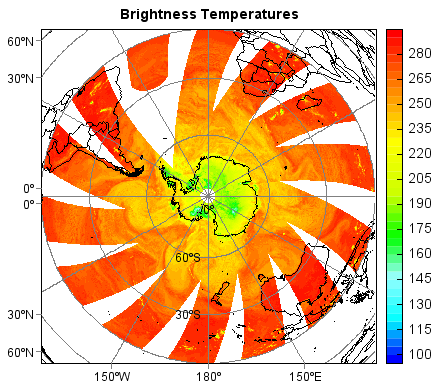
DMSP SSM/I-SSMIS Daily Polar Gridded Brightness Temperatures, Version 4
#Data source: https://nsidc.org/data/docs/daac/nsidc0001_ssmi_tbs.gd.html
#DMSP SSM/I-SSMIS Daily Polar Gridded Brightness Temperatures, Version 4

fn = 'D:/Temp/binary/tb_f17_20160413_v4_s91v.bin'

#Set projection
proj = projinfo(proj='stere', lat_ts=-70, lat_0=-90, lon_0=0)
xn = 632                      #Column number
yn = 664                      #Row number
dx = 12.5 * 1000              #X resolution (m)
dy = 12.5 * 1000              #Y resolution (m)
x0 = -3950 * 1000 + dx / 2    #Lower left x corner
y0 = -3950 * 1000 + dy / 2    #Lower left y corner
x = arange1(x0, xn, dx)
y = arange1(y0, yn, dy)

#Read data
data = binread(fn, [yn, xn], 'short')
data = data[::-1,:].astype('float')
data = data / 10
data[data==0] = nan           #0 is missing value

#Plot
axesm(projinfo=proj, gridline=True, griddx=30)
geoshow('country', edgecolor='k')
layer = imshow(x, y, data, 20, cmap='BlAqGrYeOrRe', proj=proj)
colorbar(layer)
title('Brightness Temperatures')
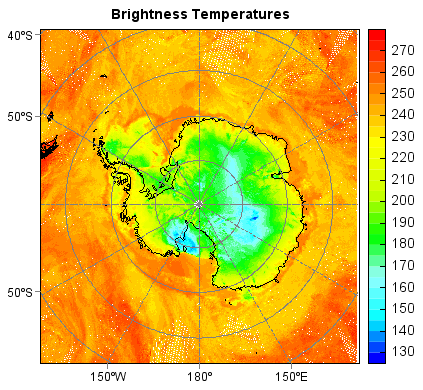
DMSP SSM/I-SSMIS Pathfinder Daily EASE-Grid Brightness Temperatures, Version 2
#Data source: https://nsidc.org/data/docs/daac/nsidc0032_ssmi_ease_tbs.gd.html
#DMSP SSM/I-SSMIS Pathfinder Daily EASE-Grid Brightness Temperatures, Version 2

fn = 'D:/Temp/binary/ID2-F17-SH2015035D-V2.91V'

#Set projection
proj = projinfo(proj='laea', lat_0=-90, lon_0=0)
xn = 1441             #Column number
yn = 1441             #Row number
dx = 12.5 * 1000      #X resolution (m)
dy = 12.5 * 1000      #Y resolution (m)
x0 = -9000 * 1000 + dx / 2     #Lower left x corner
y0 = -9000 * 1000 + dy / 2    #Lower left y corner
x = arange1(x0, xn, dx)
y = arange1(y0, yn, dy)

#Read data
data = binread(fn, [yn, xn], 'short')
data = data[::-1,:].astype('float')
data = data / 10
data[data==0] = nan   #0 is missing value

#Plot
axesm(projinfo=proj, gridline=True, griddx=30, griddy=30)
lworld = shaperead('D:/Temp/Map/country1.shp')
geoshow(lworld, edgecolor='k')
layer = imshowm(x, y, data, 20, cmap='BlAqGrYeOrRe', proj=proj)
colorbar(layer)
title('Brightness Temperatures')