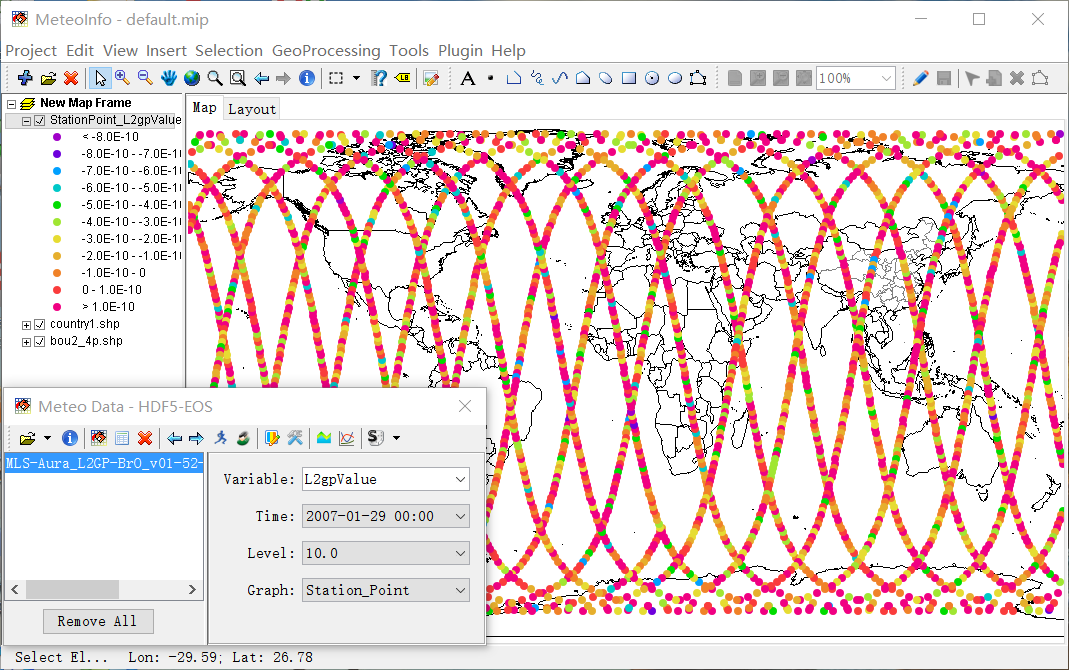
MLS Swath data
MLS (Microwave Limb Sounder) swath HDF data file follow EOS format, so it can be plotted in MeteoInfo desktop applicaiton.
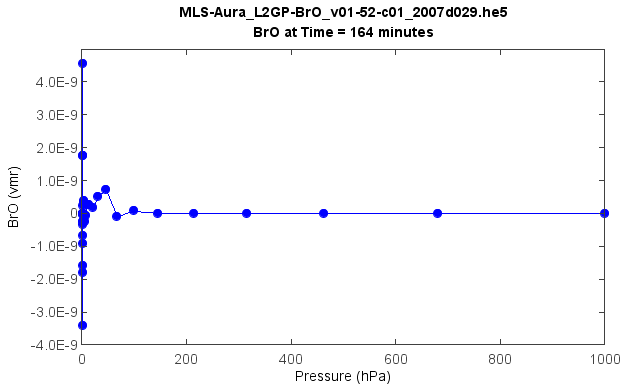
The script sample to plot vertical profile at a specific time.
fn = 'D:/Temp/hdf/MLS-Aura_L2GP-BrO_v01-52-c01_2007d029.he5'
f = addfile(fn)
tidx = 399
data = f['L2gpValue'][tidx,:]
time = f['Time'][:]
#Create an "elapsed time" variable (International Atomic Time)
telapse=(time-time[0])/60
plot(data, '-bo')
xlabel('Pressure (hPa)')
ylabel('BrO (vmr)')
title(os.path.basename(fn) + '\nBrO at Time = %i minutes' % telapse[tidx])