Tropical cyclone plot
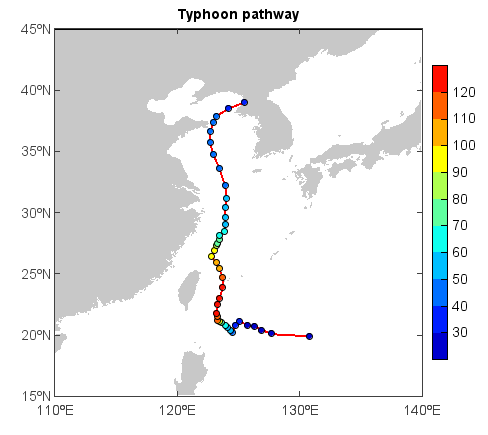
One tropical cyclone
Read an ASCII data file with tropical cyclone data, and extract longitude and latitude data. Then plot the cyclone line and points.
# Read tropical cyclone data file
fn = 'D:/Temp/ascii/198214track.dat'
tf = open(fn)
tf.readline()
aline = tf.readline()
id = aline.split()[1]
tf.readline()
lon = []
lat = []
ws = []
for aline in tf:
    print aline
    datalist = aline.split()
    lat.append(float(datalist[1]))
    lon.append(float(datalist[2]))
    t = datalist[3]
    ws.append(int(datalist[4]))
    stat = datalist[6]
    if len(datalist) == 8:
        stat = stat + ' ' + datalist[7]

# Plot
axesm()
geoshow('country', facecolor=[200,200,200])
plot(lon, lat, linewidth=2)
layer = scatter(lon, lat, ws)
colorbar(layer, shrink=0.8)
xlim(110, 140)
ylim(15, 45)
title('Typhoon pathway')
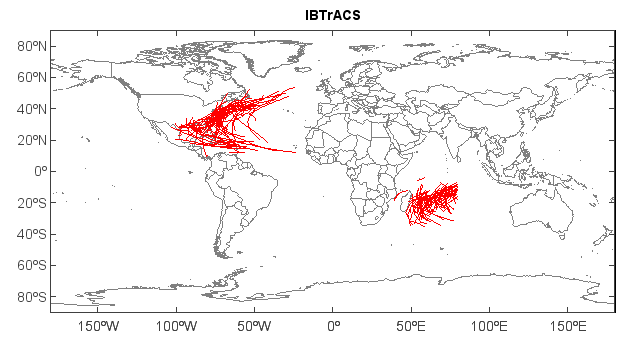
Multiple tropical cyclones
Read mutiple tropical cyclones longitude/latitude data from a netCDF data file (https://climatedataguide.ucar.edu/climate-data/ibtracs-tropical-cyclone-best-track-data) and plot them.
fn = 'D:/Temp/nc/Allstorms.ibtracs_wmo.v03r06.nc'
f = addfile(fn)
lons = f['lon_wmo'][:200,:]
lats = f['lat_wmo'][:200,:]
lons[lons==-327.67] = nan
lats[lats==-327.67] = nan
xd = []
yd = []
for i in range(0, lons.dimlen(0)):
    xd.extend(lons[i,:].aslist())
    yd.extend(lats[i,:].aslist())
    xd.append(nan)
    yd.append(nan)

# Plot
axesm()
geoshow('country')
layer = plotm(xd, yd)
title('IBTrACS')
xlim(-180, 180)
ylim(-90, 90)
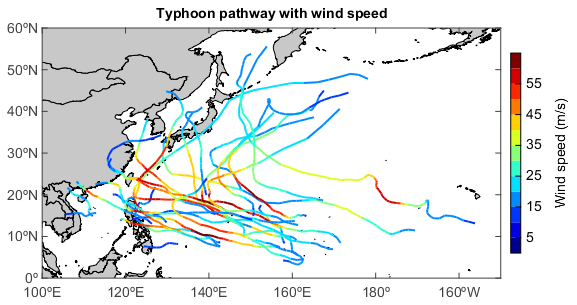
Multiple tropical cyclones with wind speed
Read mutiple tropical cyclones data from a txt data file (http://tcdata.typhoon.gov.cn/zjljsjj_zlhq.html) and plot them. The colors of the line indicate wind speed.
# Read typhoon data file
fn = 'D:/Temp/ascii/CH2015BST.txt'
tf = open(fn)
lons = []
lats = []
prss = []
wss = []
for line in tf:
    print line
    data = line.split()
    pn = int(data[2])
    for i in range(pn):
        line = tf.readline()
        data = line.split()
        lat = float(data[2])
        lats.append(lat * 0.1)
        lon = float(data[3])
        lons.append(lon * 0.1)
        t = data[0]
        prs = float(data[4])
        prss.append(prs)
        ws = float(data[5])
        wss.append(ws)
    lons.append(nan)
    lats.append(nan)
    prss.append(nan)
    wss.append(nan)

# Plot
axesm()
geoshow('country', facecolor=[200,200,200])
levs = arange(5, 61, 5)
cols = makecolors(len(levs) + 1)
layer = plot(lons, lats, zvalues=wss, levels=levs, colors=cols, size=2)
colorbar(layer, shrink=0.8, label='Wind speed (m/s)')
xlim(100, 210)
ylim(0, 60)
title('Typhoon pathway with wind speed')