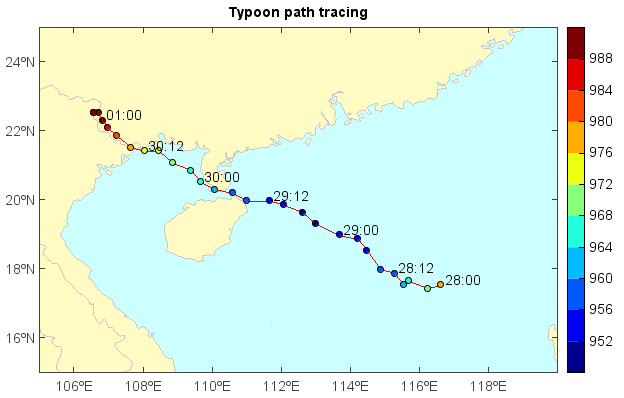
Tracing typhoon pathway
Read sea surface pressure data and find the minimum value locations as typhoon pathway.
fn = 'D:/Temp/GrADS/928slp.ctl'
f = addfile(fn)
slp = f['slvl']
lat = slp.dimvalue(1)
lon = slp.dimvalue(2)
tt = f.gettimes()
tlat = []
tlon = []
press = []
for t in range(f.timenum()-1):
    data = slp[t,:,:]
    idx = data.argmin()
    idx = unravel_index(idx, data.shape)
    tlat.append(lat[idx[0]])
    tlon.append(lon[idx[1]])
    press.append(data[idx[0],idx[1]])

#Plot
axesm(bgcolor=(204,255,255))
geoshow('country', edgecolor=[200,200,200], facecolor=(255,251,195))
plot(tlon, tlat)
layer = scatter(tlon, tlat, press)
colorbar(layer)
for t in range(0, f.timenum()-1, 4):
    text(tlon[t]+0.1, tlat[t], tt[t].strftime('%d:%H'))
xlim(105, 120)
ylim(15, 25)
title('Typoon path tracing')