MeteoInfo 1.4.8 was released (2018-2-8)
Add
mlinregress(mutiple linear regression function) andpercentilefunctions instatsmodule.Add Add DOUBLE_CIRCLE and CIRCLE_STAR point symbols.
Add PointZ shape support for shape file.
Add loadmip method in MapAxes class to load MeteoInfo project file (.mip) in MeteoInfoLab.
Add
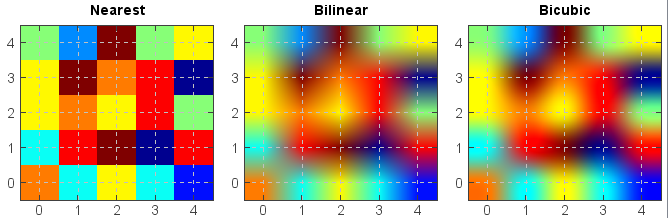
bilinearandbicubicinterpolation property in ImageLayer, also interpolation argument was added inimshowandimshowmfunctions.Add
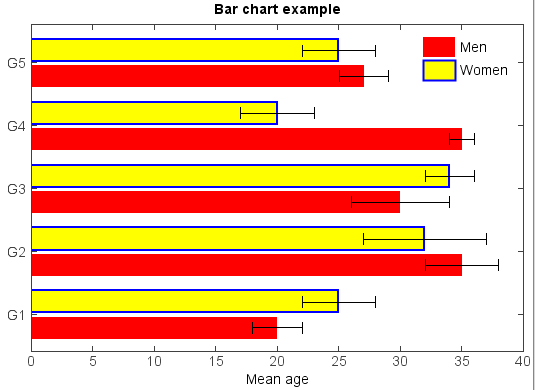
barhfunction inmiplotmodule to plot horizontal bar chart.Add up folder and folder update buttons in
File explorerpanel.Some bug fix and existing functions update.
Image interpolation:
A = random.rand(5, 5)

fig, axs = plt.subplots(1, 3, figsize=(10, 3))
for ax, interp in zip(axs, ['nearest', 'bilinear', 'bicubic']):
    caxes(ax)
    imshow(A, interpolation=interp)
    title(interp.capitalize())
    xticks(arange(0,5))
    yticks(arange(0,5))
    grid(True)
Horizontal bar:
menMeans = [20, 35, 30, 35, 27]
std_men = (2, 3, 4, 1, 2)
n = len(menMeans)
ind = arange(n)
height = 0.35
gap = 0.06
axes(outerposition=[0,0,1,1])
barh(ind, menMeans, height, xerr=std_men, color='r', label='Men', \
    edgecolor=None)

womenMeans = [25, 32, 34, 20, 25]
std_women = (3, 5, 2, 3, 3)
barh(ind + height + gap, womenMeans, height, xerr=std_women, color='y', \
    label='Women', edgecolor='b', linewidth=2)

ylim(-0.2, 5)
xlim(0, 40)
xlabel('Mean age')
yticks(ind + height + gap * 0.5, ['G1','G2','G3','G4','G5'])
legend(markerscale=2, frameon=False)
title('Bar chart example')