MeteoInfo 3.3.0 was released (2022-2-14)
Add earth sphere 3D axes
Add
xysliceargument in slice3, contoursclice, contourfslice and streamslice functionsSupport image texture rendering in
surffunctionUpdate
volumeplotfunction with ray casting algorithms ofbasic,max_valueandspecularAdd
sinh,coshandtanhfunctionsimprove
meteolibfunctionsImprove image output functions with tif file support
Add GeoQ web tile maps
Add Yahei hybrid font
Support micaps data file with BOM using Apache commons io library
Update pro4j to 1.1.4
Update FlatLaf to version 2.0.1
Some bug fixed
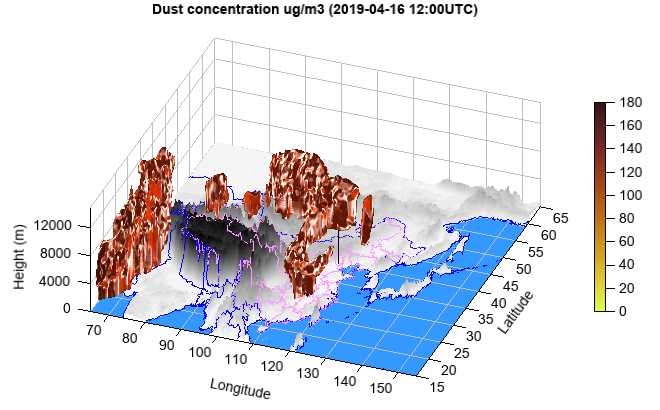
volume plot with ``specular`` ray casting and transfer function:
#Set date
sdate = datetime.datetime(2019, 4, 15, 0)

#Set directory
datadir = 'D:/Temp/mm5'

#Read data
fn = os.path.join(datadir, 'WMO_SDS-WAS_Asian_Center_Model_Forecasting_CUACE-DUST_CMA_'+ sdate.strftime('%Y%m%d%H') + '.nc')
f = addfile(fn)
st = f.gettime(0)
t = 12
dust = f['CONC_DUST'][t,:,'15:65','65:155']
levels = dust.dimvalue(0)
dust[dust==nan] = 0
height = meteolib.pressure_to_height_std(levels)
lat = dust.dimvalue(1)
lon = dust.dimvalue(2)

#Relief data
rfn = 'D:/Temp/nc/elev.0.25-deg.nc'
rf = addfile(rfn)
elev = rf['data'][0,'15:65','65:155']
elev[elev<0] = -1
lon1 = elev.dimvalue(1)
lat1 = elev.dimvalue(0)
lon1, lat1 = meshgrid(lon1, lat1)

#Map
lchina = shaperead('cn_province')
clon = lchina.x_coord
clat = lchina.y_coord
calt = zeros(len(clon))
h = interp2d(elev, clon, clat)
calt = calt + h
lworld = shaperead('country')
wlon = lworld.x_coord
wlat = lworld.y_coord
walt = zeros(len(wlon))
h = interp2d(elev, wlon, wlat)
walt = walt + h

#Plot
ax = axes3d(clip_plane=False)
ax.set_elevation(-20)
ax.set_rotation(335)
rlevs = arange(0, 6000, 200)
cols = makecolors(len(rlevs) + 1, cmap='MPL_gist_yarg', alpha=1)
cols[0] = [51,153,255]
surf(lon1, lat1, elev, rlevs, facecolor='interp', colors=cols, edge=False)
plot3(clon, clat, calt, color=[255,153,255])
plot3(wlon, wlat, walt, color='b')
#Beijing location
plot3([116.39,116.39], [39.91,39.91], [0,12000])
pp = volumeplot(lon, lat, height, dust, ray_casting='specular',
    cmap='cmocean_solar_r', vmax=180, brightness=2.5,
    opacity_nodes=[90,100,120,121], opacity_levels=[0,0.5,0.5,0])
colorbar(pp, aspect=30)
xlim(65, 155)
xlabel('Longitude')
ylim(15, 65)
ylabel('Latitude')
zlim(0, 15000)
zlabel('Height (m)')
tt = st + datetime.timedelta(hours=t*3)
title('Dust concentration ug/m3 ({}UTC)'.format(tt.strftime('%Y-%m-%d %H:00')))
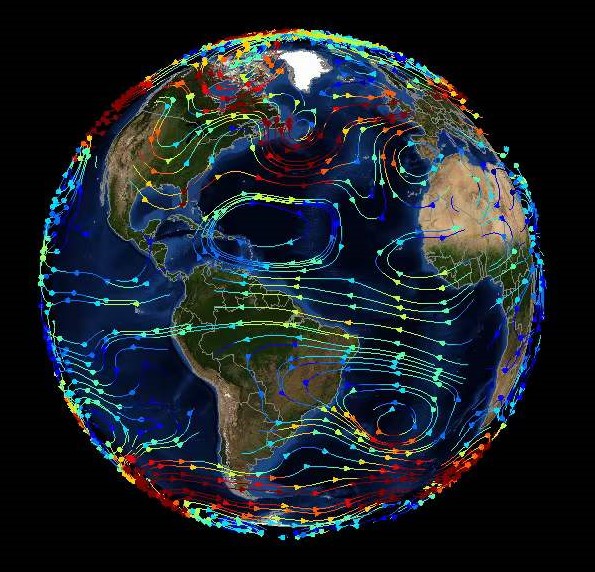
Stream slice on 3D earth:
fn = os.path.join(migl.get_sample_folder(), 'GrADS', 'model.ctl')
f = addfile(fn)
u = f['U'][0]
v = f['V'][0]
levels = u.dimvalue(0)
height = meteolib.pressure_to_height_std(levels) / 10
lat = u.dimvalue(1)
lon = u.dimvalue(2)
w = zeros(u.shape)
speed = sqrt(u*u + v*v)

ax = axes3d(projection='earth')
geoshow('country', edgecolor='gray')
levs = arange(2, 20, 2)
streamslice(lon, lat, height, u, v, w, speed, levs=levs, zslice=[300],
    interval=10)
colorbar(tickcolor='w', xshift=80)
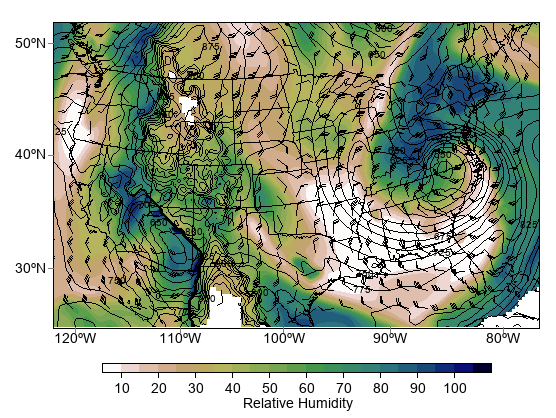
isentropic_analysis:
fn = 'D:/Temp/nc/narr_example.nc'
f = addfile(fn)
pres = f['isobaric'][:]
tmpk = f['Temperature'][:]
u_wind = f['u_wind'][:]
v_wind = f['v_wind'][:]
sh = f['Specific_humidity'][:]
y = tmpk.dimvalue(-2)
x = tmpk.dimvalue(-1)

isentlevs = [296.]
pres, tmpk, u_wind, v_wind, sh = meteolib.isentropic_interpolation(isentlevs, pres,
    tmpk, u_wind, v_wind, sh, temperature_out=True)
rh = meteolib.relative_humidity_from_specific_humidity(pres, tmpk, sh) * 100

#plot
axesm(projinfo=f.proj)
geoshow('us_states')
geoshow('country')
# Plot rh
levs = arange(10., 106, 5)
grh = contourf(x, y, rh[0], levs, cmap='MPL_gist_earth_r', proj=f.proj)
colorbar(grh, orientation='horizontal', aspect=40, shrink=0.8,
    label='Relative Humidity')
# Plot the surface
clevisent = arange(0, 1000, 25)
cs = contour(x, y, pres[0], clevisent, colors='k', linewidths=1.0, proj=f.proj)
clabel(cs, fontsize=10, fmt='%i', drawshadow=False)
# Plot wind barbs
xx, yy = meshgrid(x, y)
wind_slice = slice(None, None, 6)
barbs(xx[wind_slice,wind_slice], yy[wind_slice,wind_slice], u_wind[0,wind_slice,wind_slice], v_wind[0,wind_slice,wind_slice],
    size=6, proj=f.proj)

axis([-122, -75, 25, 50])