geoshow 3D
- Axes3DGL.geoshow(layer, **kwargs):
Plot a layer map in 3D axes.
- Parameters:
layer – (str or MILayer) The layer to be plotted.
offset – (float) Location on z axis.
xshift – (float) X coordinate shift.
facecolor – (color) Face color.
edgecolor – (color) Edge color.
linewidth – (float) Line width.
- Returns:
Graphics.
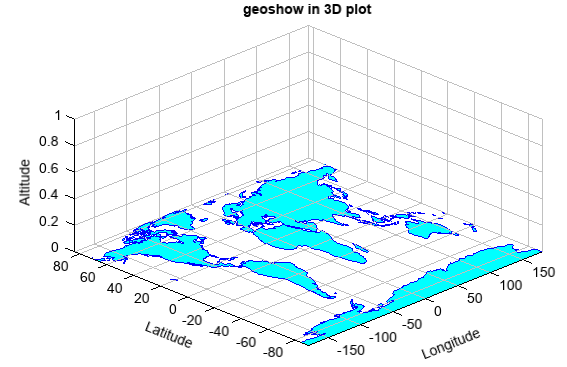
Example of 3D
geoshowax = axes3d() geoshow('continent', facecolor='c', edgecolor='b') zlim(0, 1) title('geoshow in 3D plot') xlabel('Longitude') ylabel('Latitude') zlabel('Altitude')
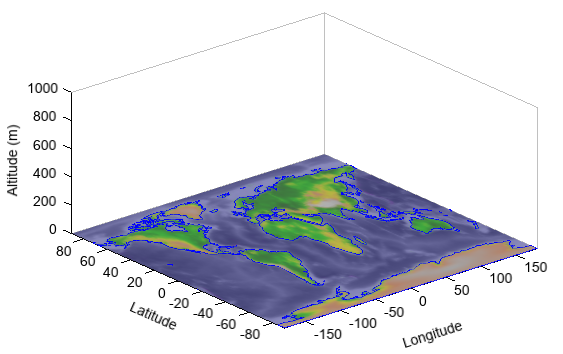
Plot geo-located image using
geoshowfunctionax = axes3d() grid(False) layer = georead('global_shade.jpg') geoshow(layer) geoshow('continent', edgecolor='b', offset=1) zlim(0, 1000) xlabel('Longitude') ylabel('Latitude') zlabel('Altitude (m)')